Visualizing the impact on mental health
Dive into the following data-driven analyses of how working remotely or in the office influences mental well-being. These graphics illustrate key trends and offer valuable insights for understanding this critical topic.
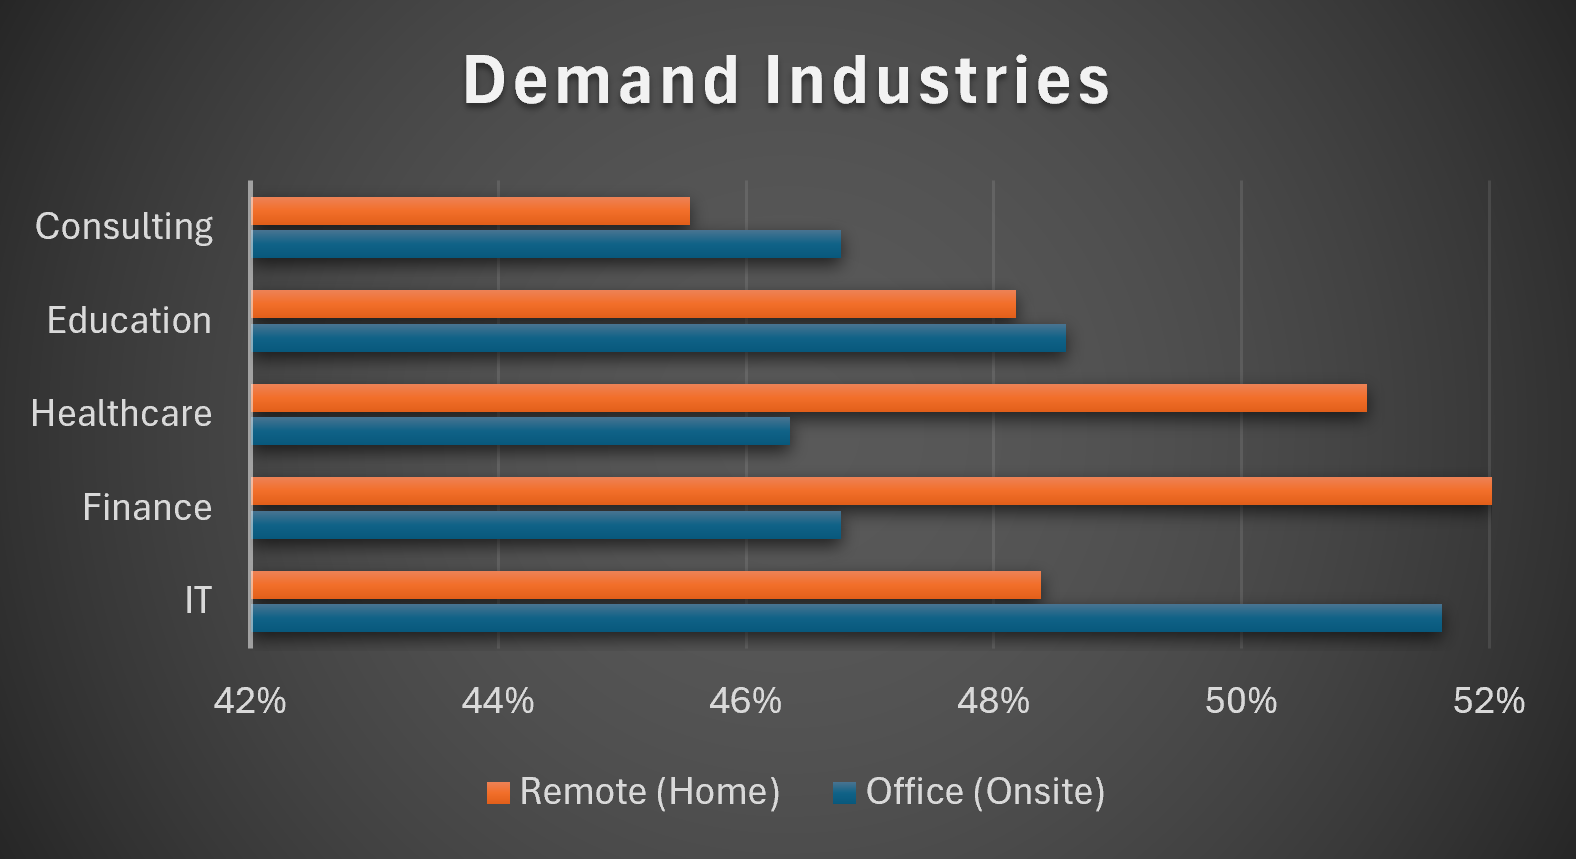
Industry in demand
Which industry is higher in demand and work setting do they work the most?
The graph shown on the right lists the top five industries in demand and the percentage of working remotely and working in a traditional office setting. It shows healthcare and finance industries demands are higher in remote positions than consulting, education, or IT industries.
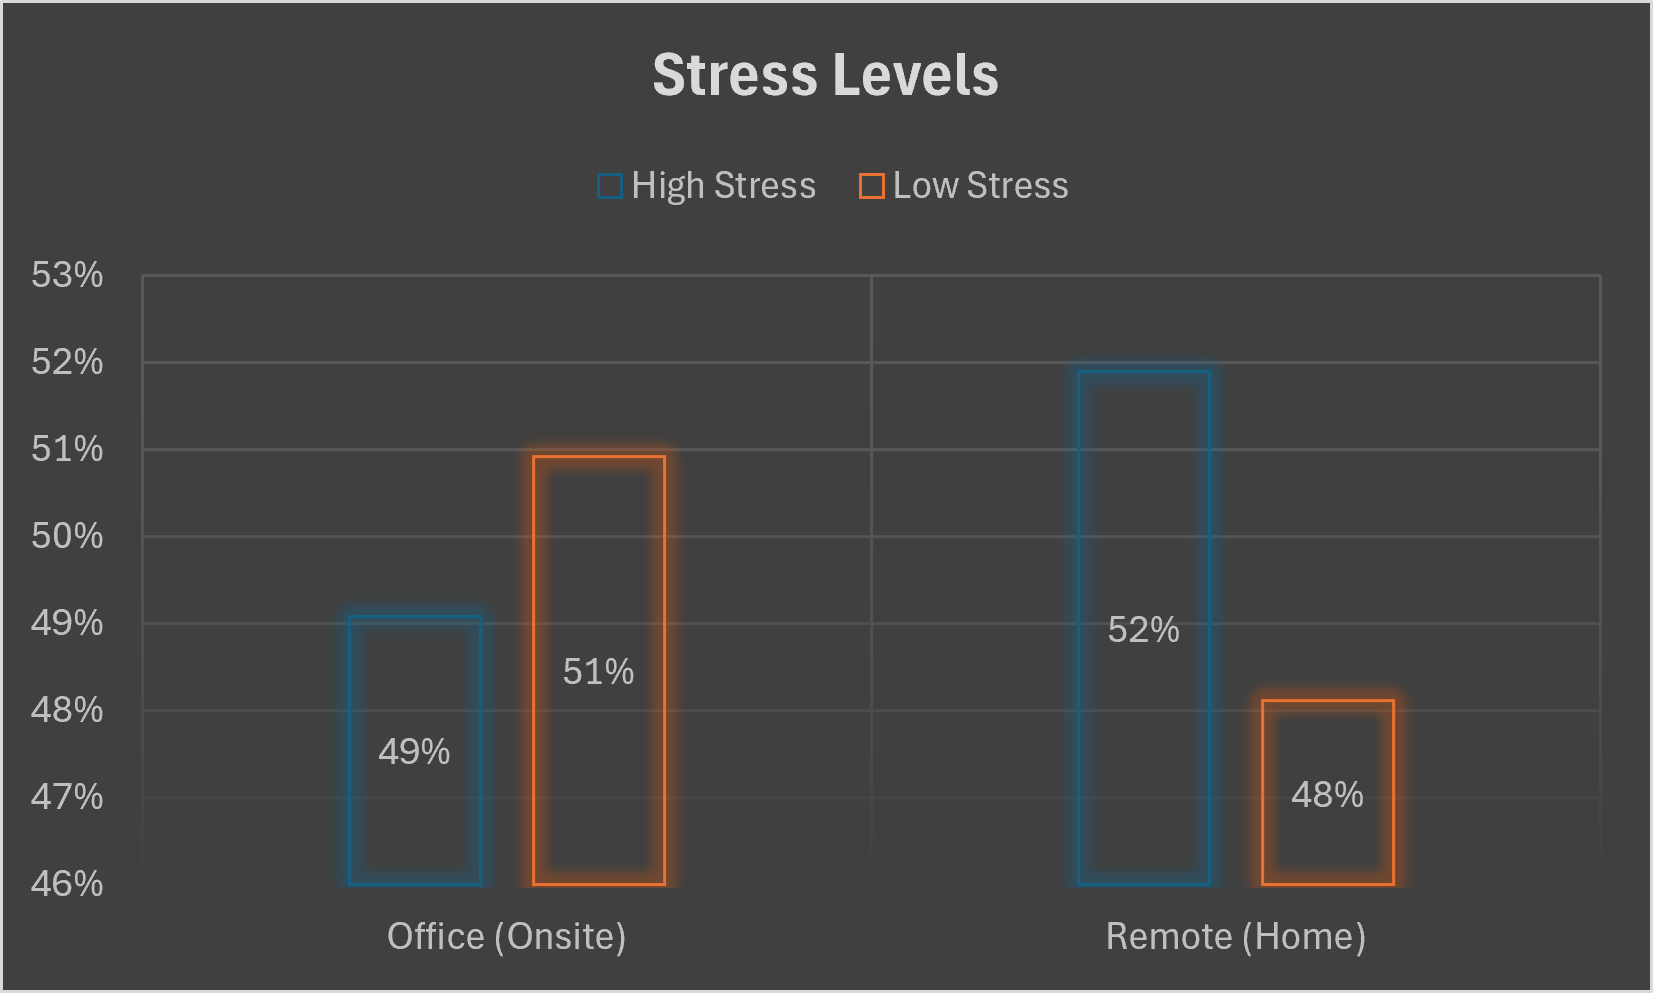
Stress levels: remote vs. office
Which work location has the highest stress level?
The graph shown on the left compares reported stress levels between working remotely and working in a traditional office setting. Observe the significant stress level differences that impact mental strain in each environment. The stress level in remote positions is 3% higher than working in the office.
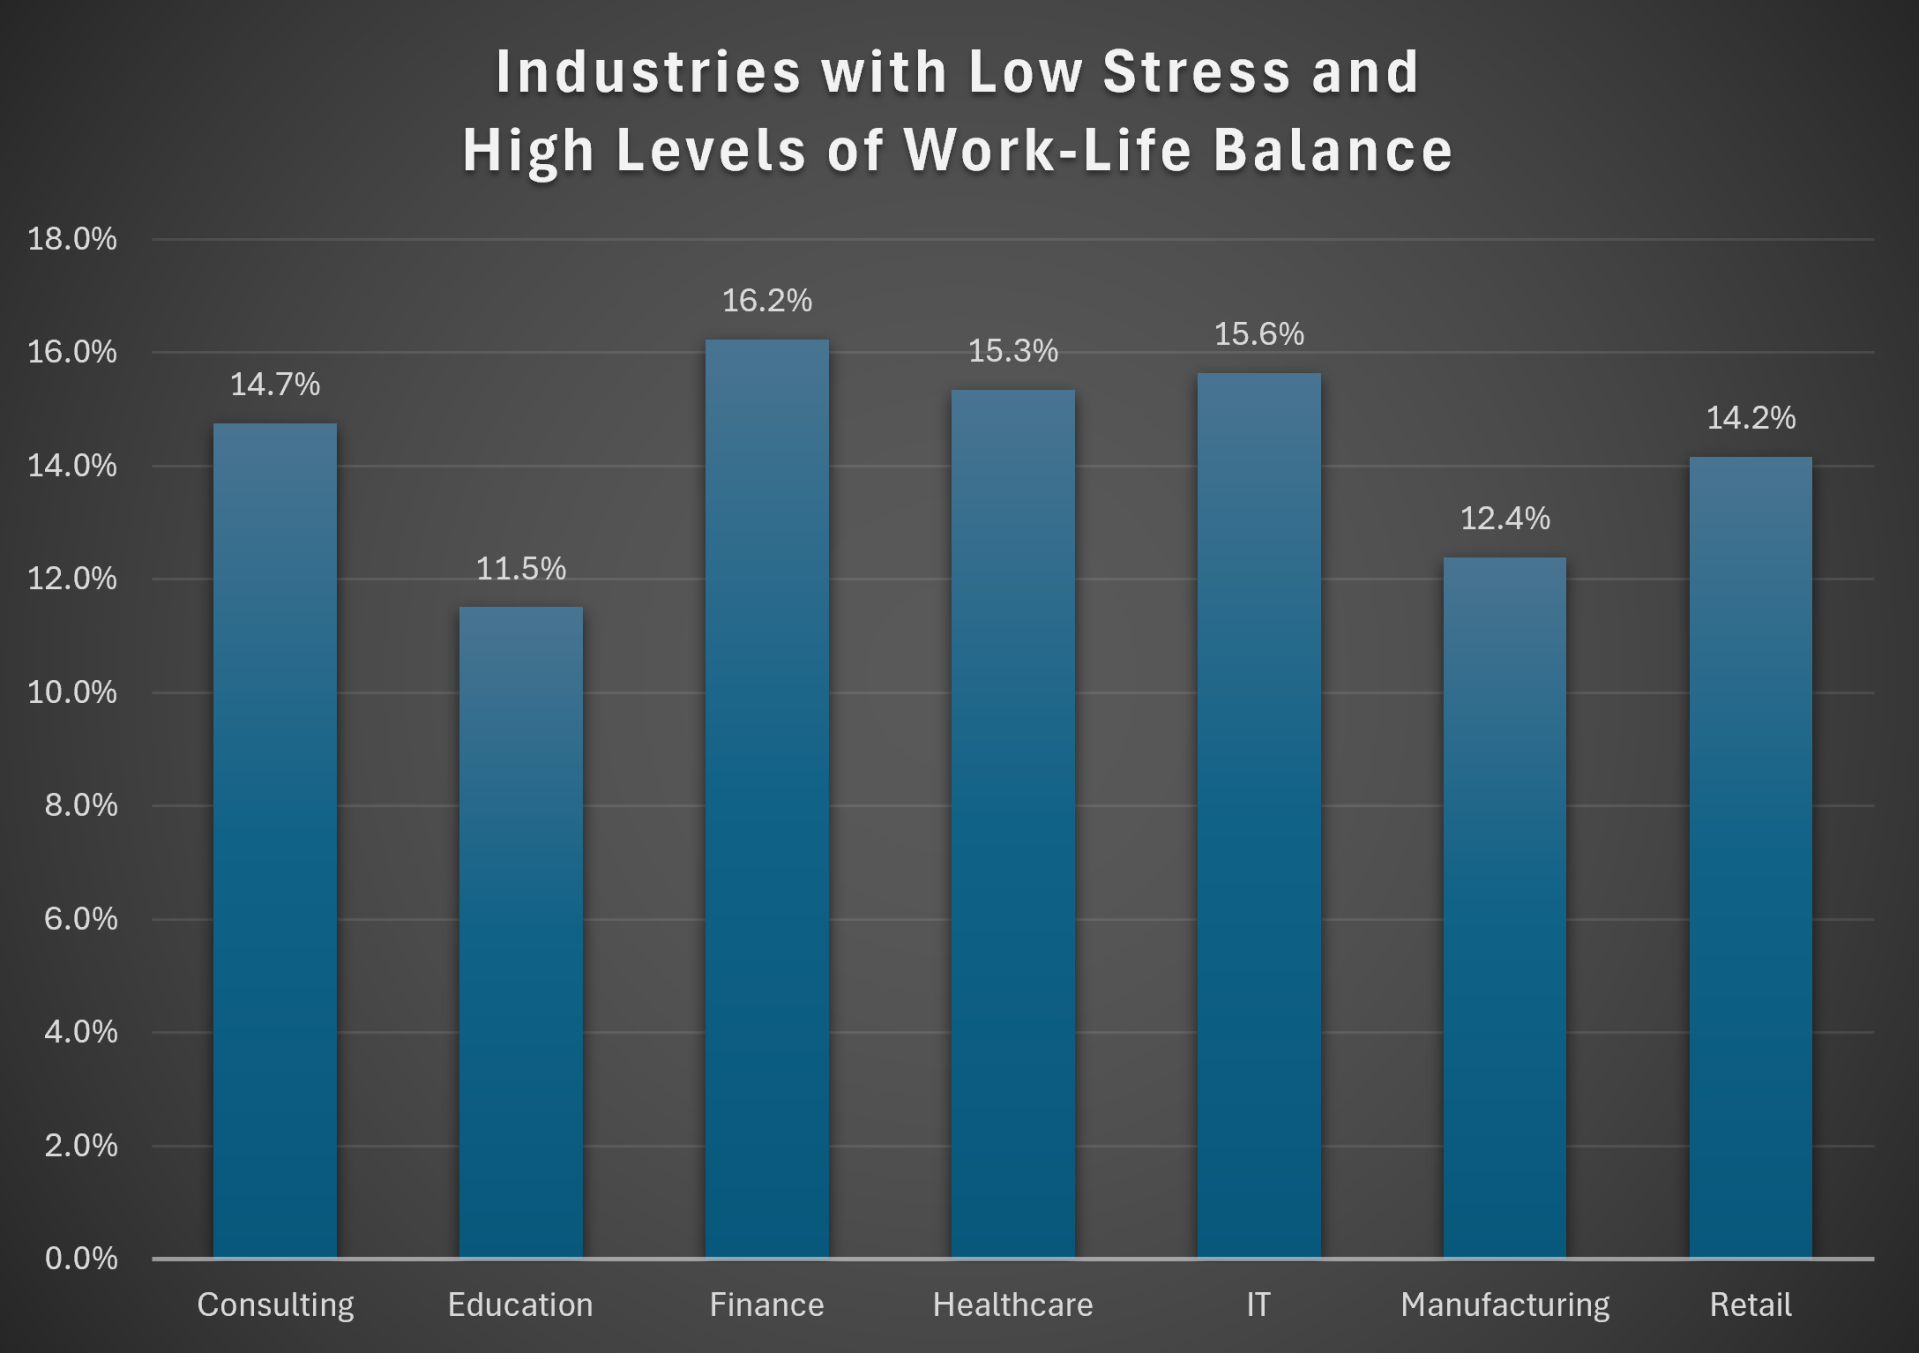
Industries with low stress levels and work-life balances
Which industries have low stress levels and high levels of work-life balance?
There are seven industries that have been identified with low stress levels and high levels of work-life balance. The finance industry has the highest level of work-life balance, which is 16.2%. This is 4.7% higher than the education industry.
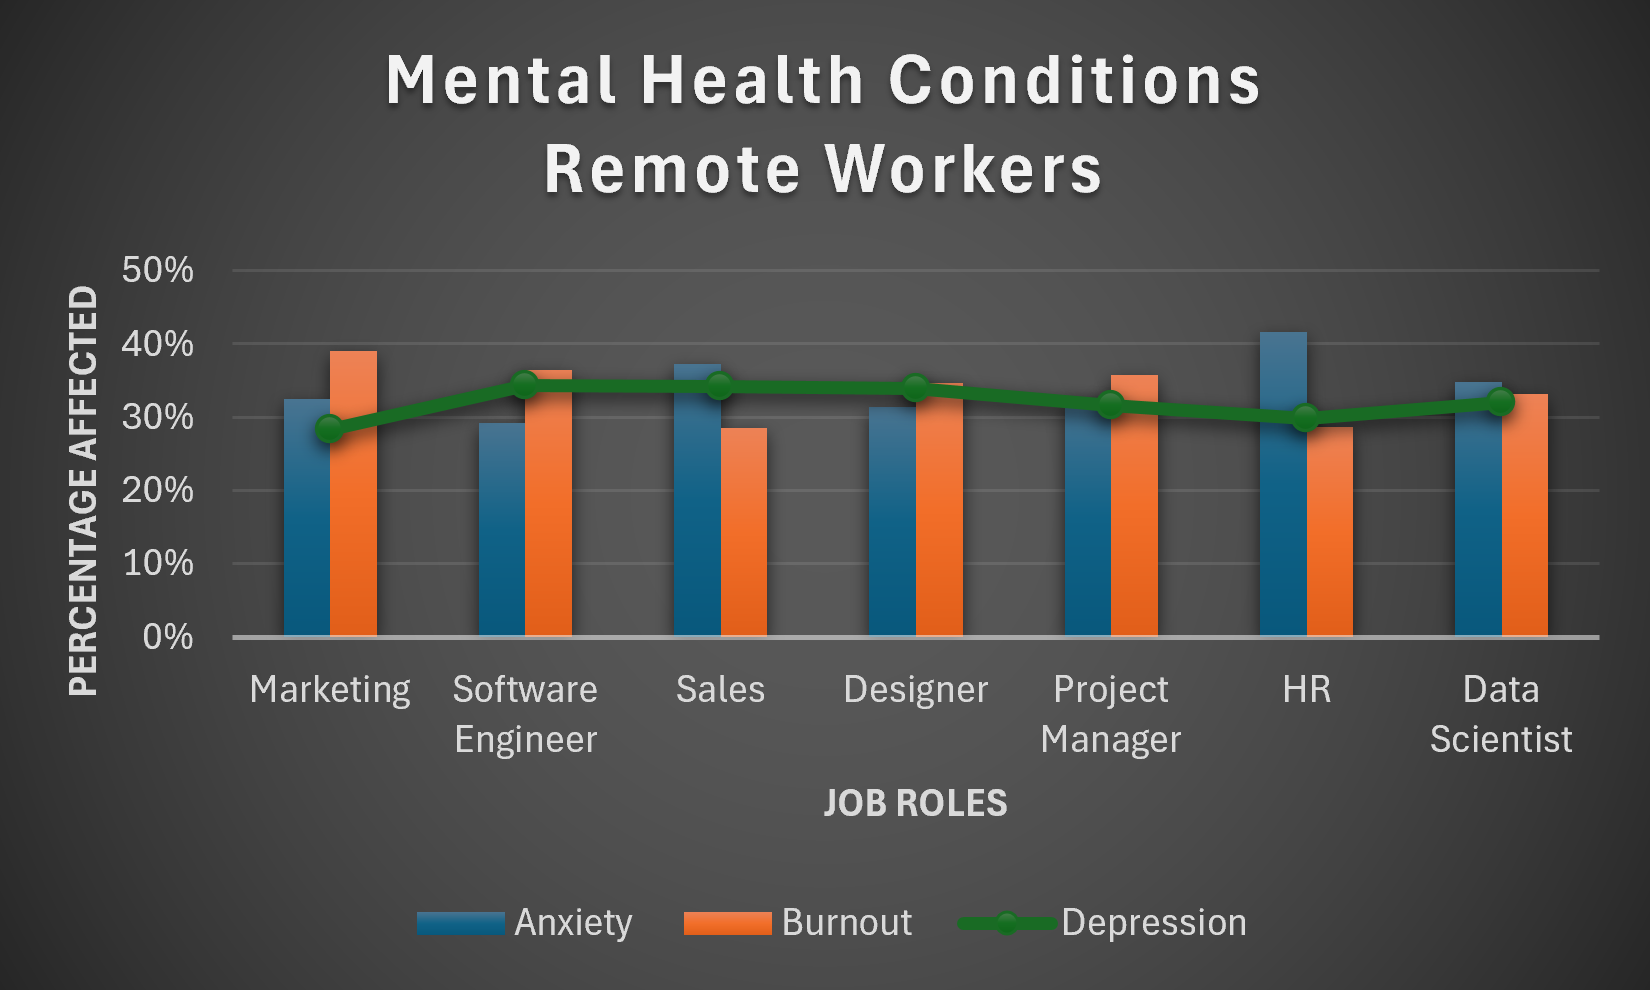
Mental health conditions
Mental health conditions affect each job role differently. Which remote job role is affected the most?
The bar chart on the left highlights three mental health conditions that remote employees endure. Observe that some remote job roles can experience multiple mental health conditions like data scientists.
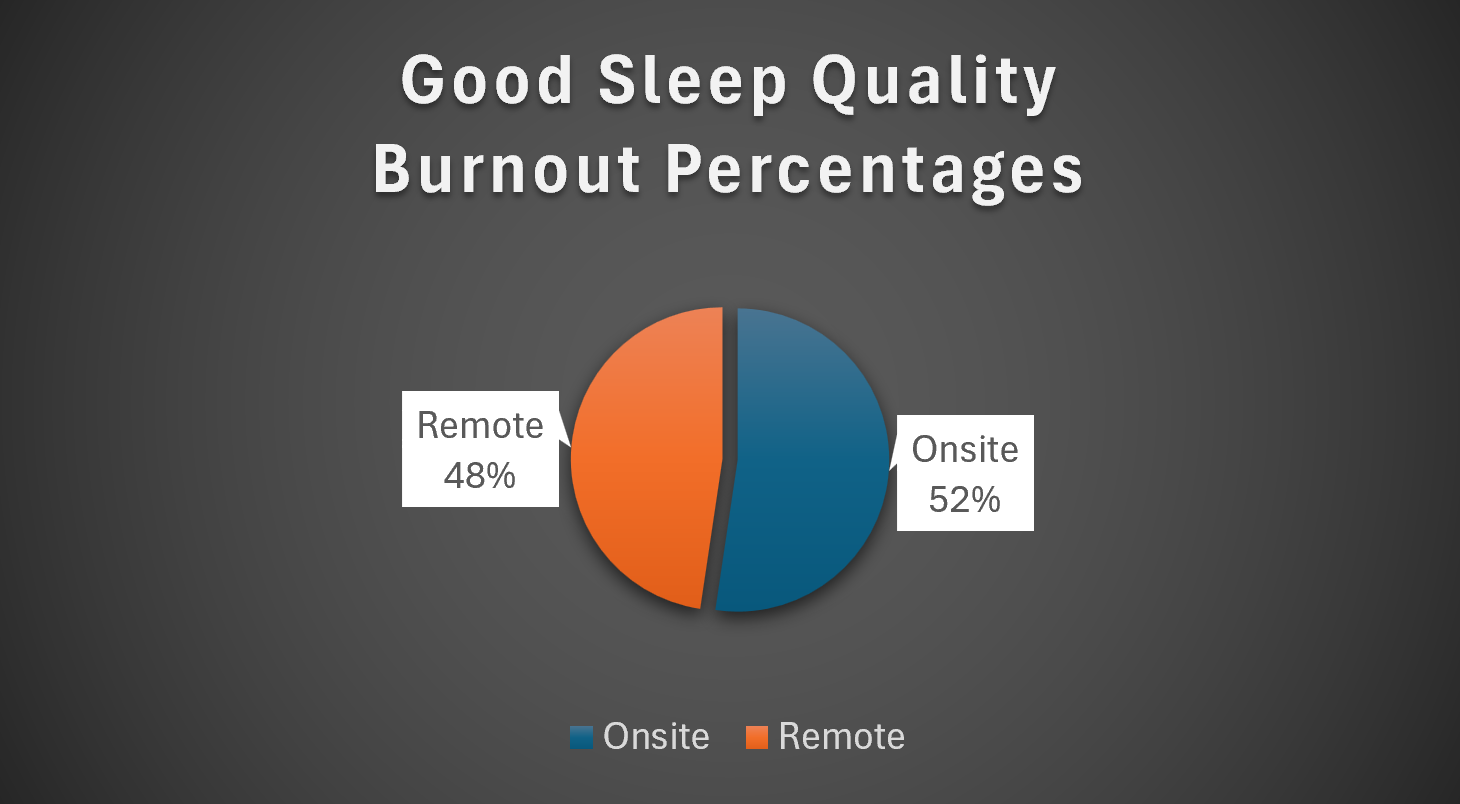
Sleep quality affect mental health
Does work location contribute to sleep quality? Does sleep quality affect mental health?
This pie chart highlights good sleeping quality on both remote and onsite positions. Based on the percentages, 2% more of onsite employees get burnouts than the remote employees even though they both get good night sleep.
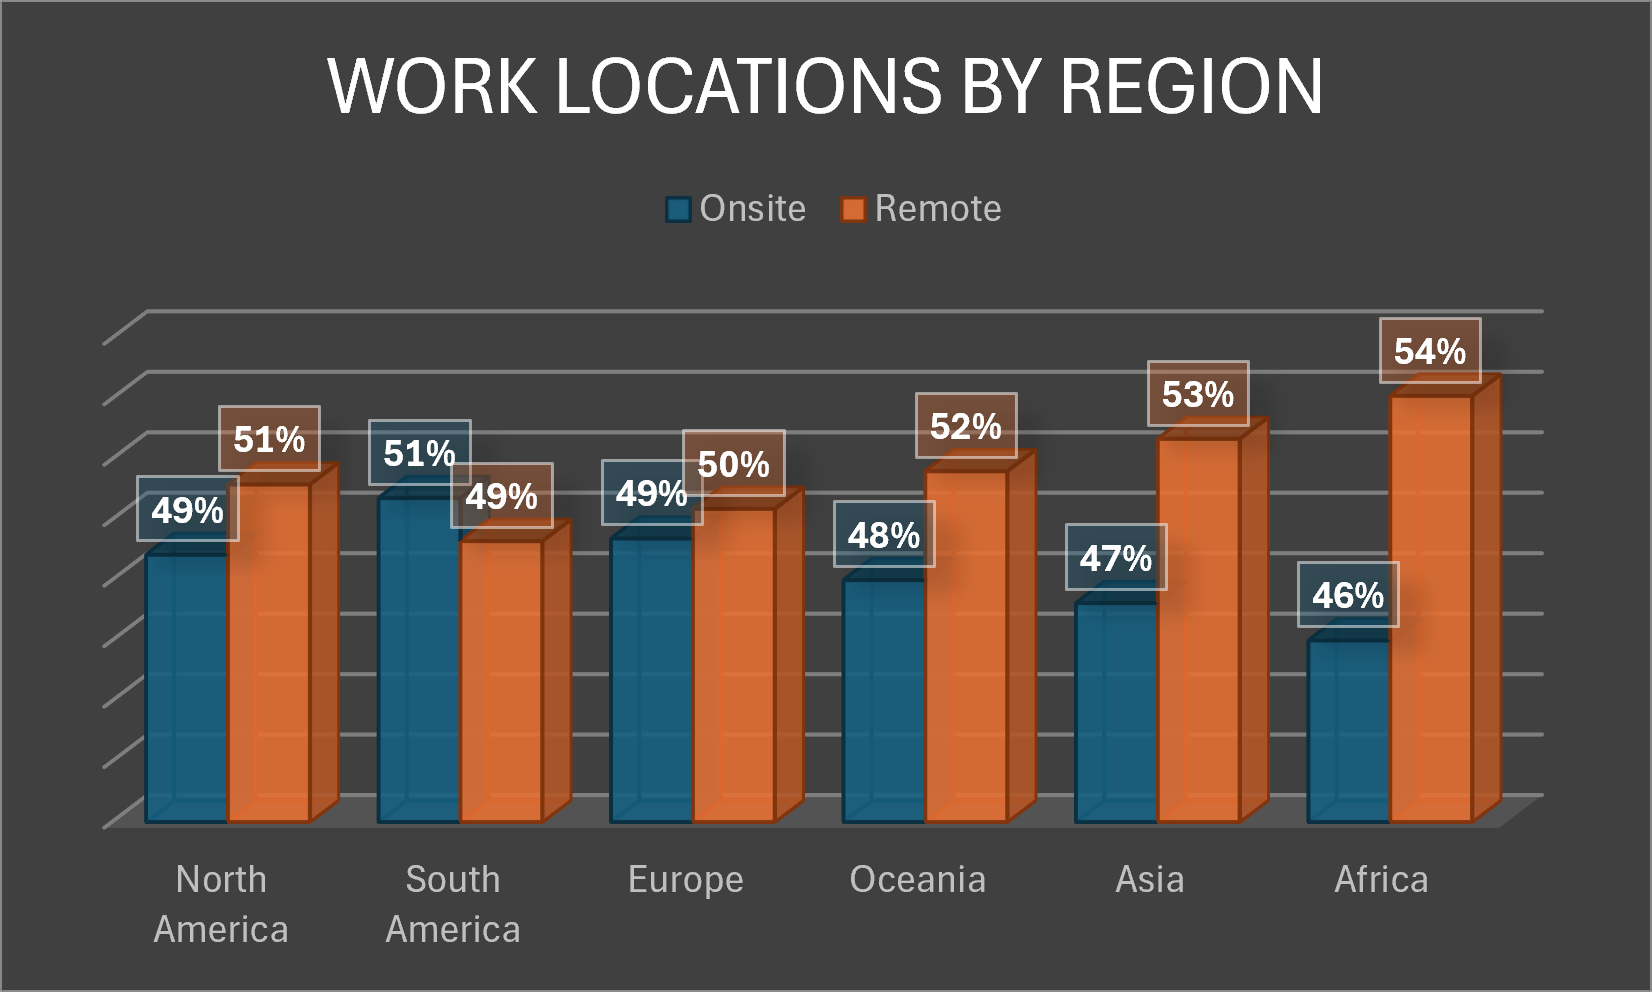
Working remotely is on the rise.
Which region has the highest number of employees working remotely?
This bar chart highlights the different regions and what their percentage rate for office(onsite) and remote (home) positions. Working from home is 1% - 6% higher in all regions except for South America where 2% more workers prefer to work onsite.
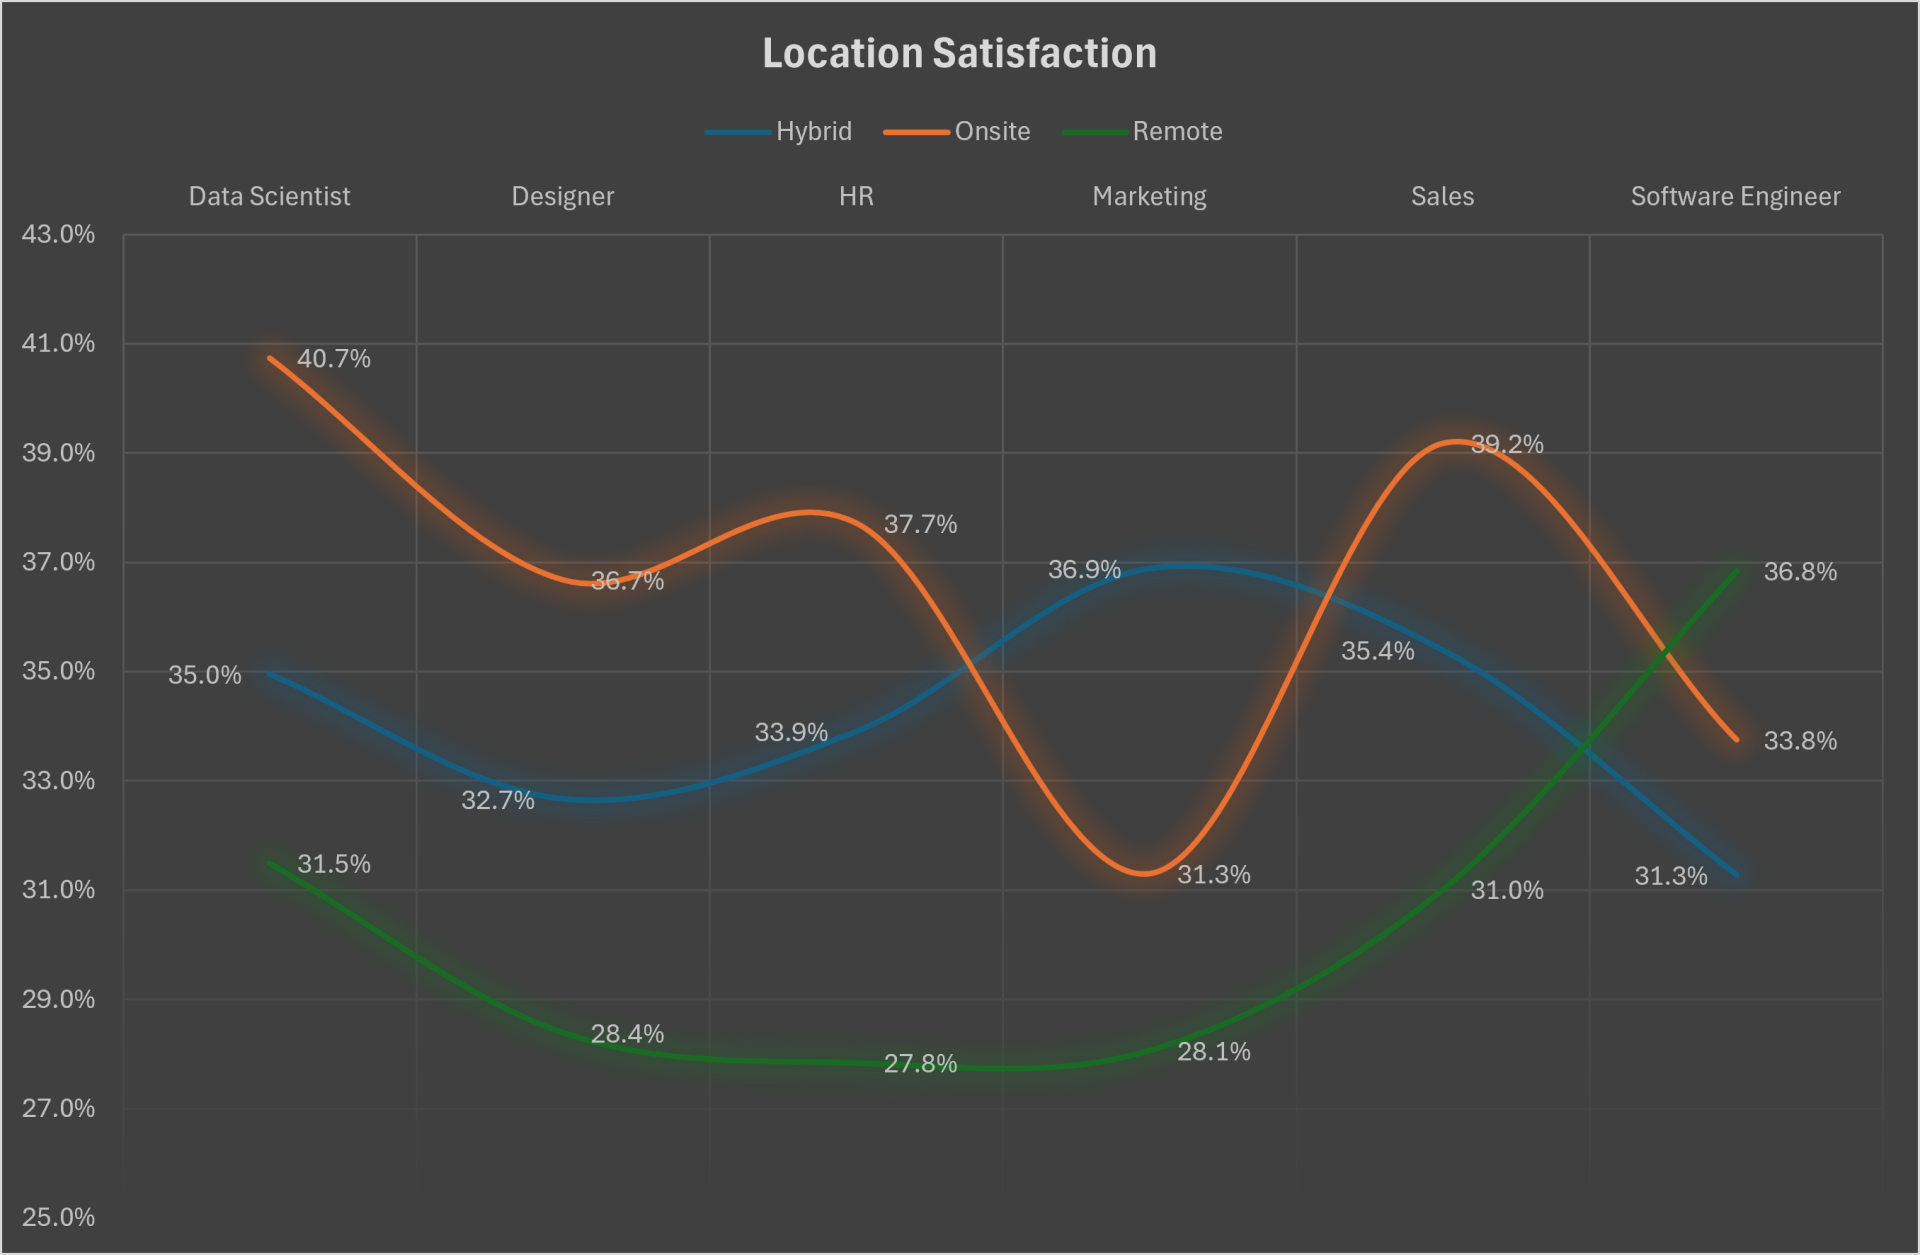
Job roles satisfied with working arrangements
Which job role is satisfied with the type of work location they were hired for?
This line chart highlights six job roles and displays their location satisfaction rating for which they were hired for. With 40.7% of data scientists satisfied with working onsite, 36.9% of marketing satisfied with working hybrid, and 36.8% of software engineers satisfied with working remotely, the data still shows working remotely is still not a desirable work location for most job roles.